

Accurately track your supply chain sustainability
TraceMark™ allows you to gain better transparency and visibility into each step of your supply chain. As consumers and investors increasingly prioritize sustainability, it is important to understand your company’s environmental impact.
TraceMark™ enables you to support internal reporting and keep your sustainability efforts on track. The TraceMark product can track and trace your supply chain from when it’s a raw material to a product on the shelf.
TraceMark™ can help you make informed green decisions with insights into any impact on sourcing from the environment to the local communities, suppliers and many more. These insights allow you to make meaningful, considerate decisions and action plans, wherever and whenever necessary.

Reach out to us today to take the next steps in your sustainability journey.
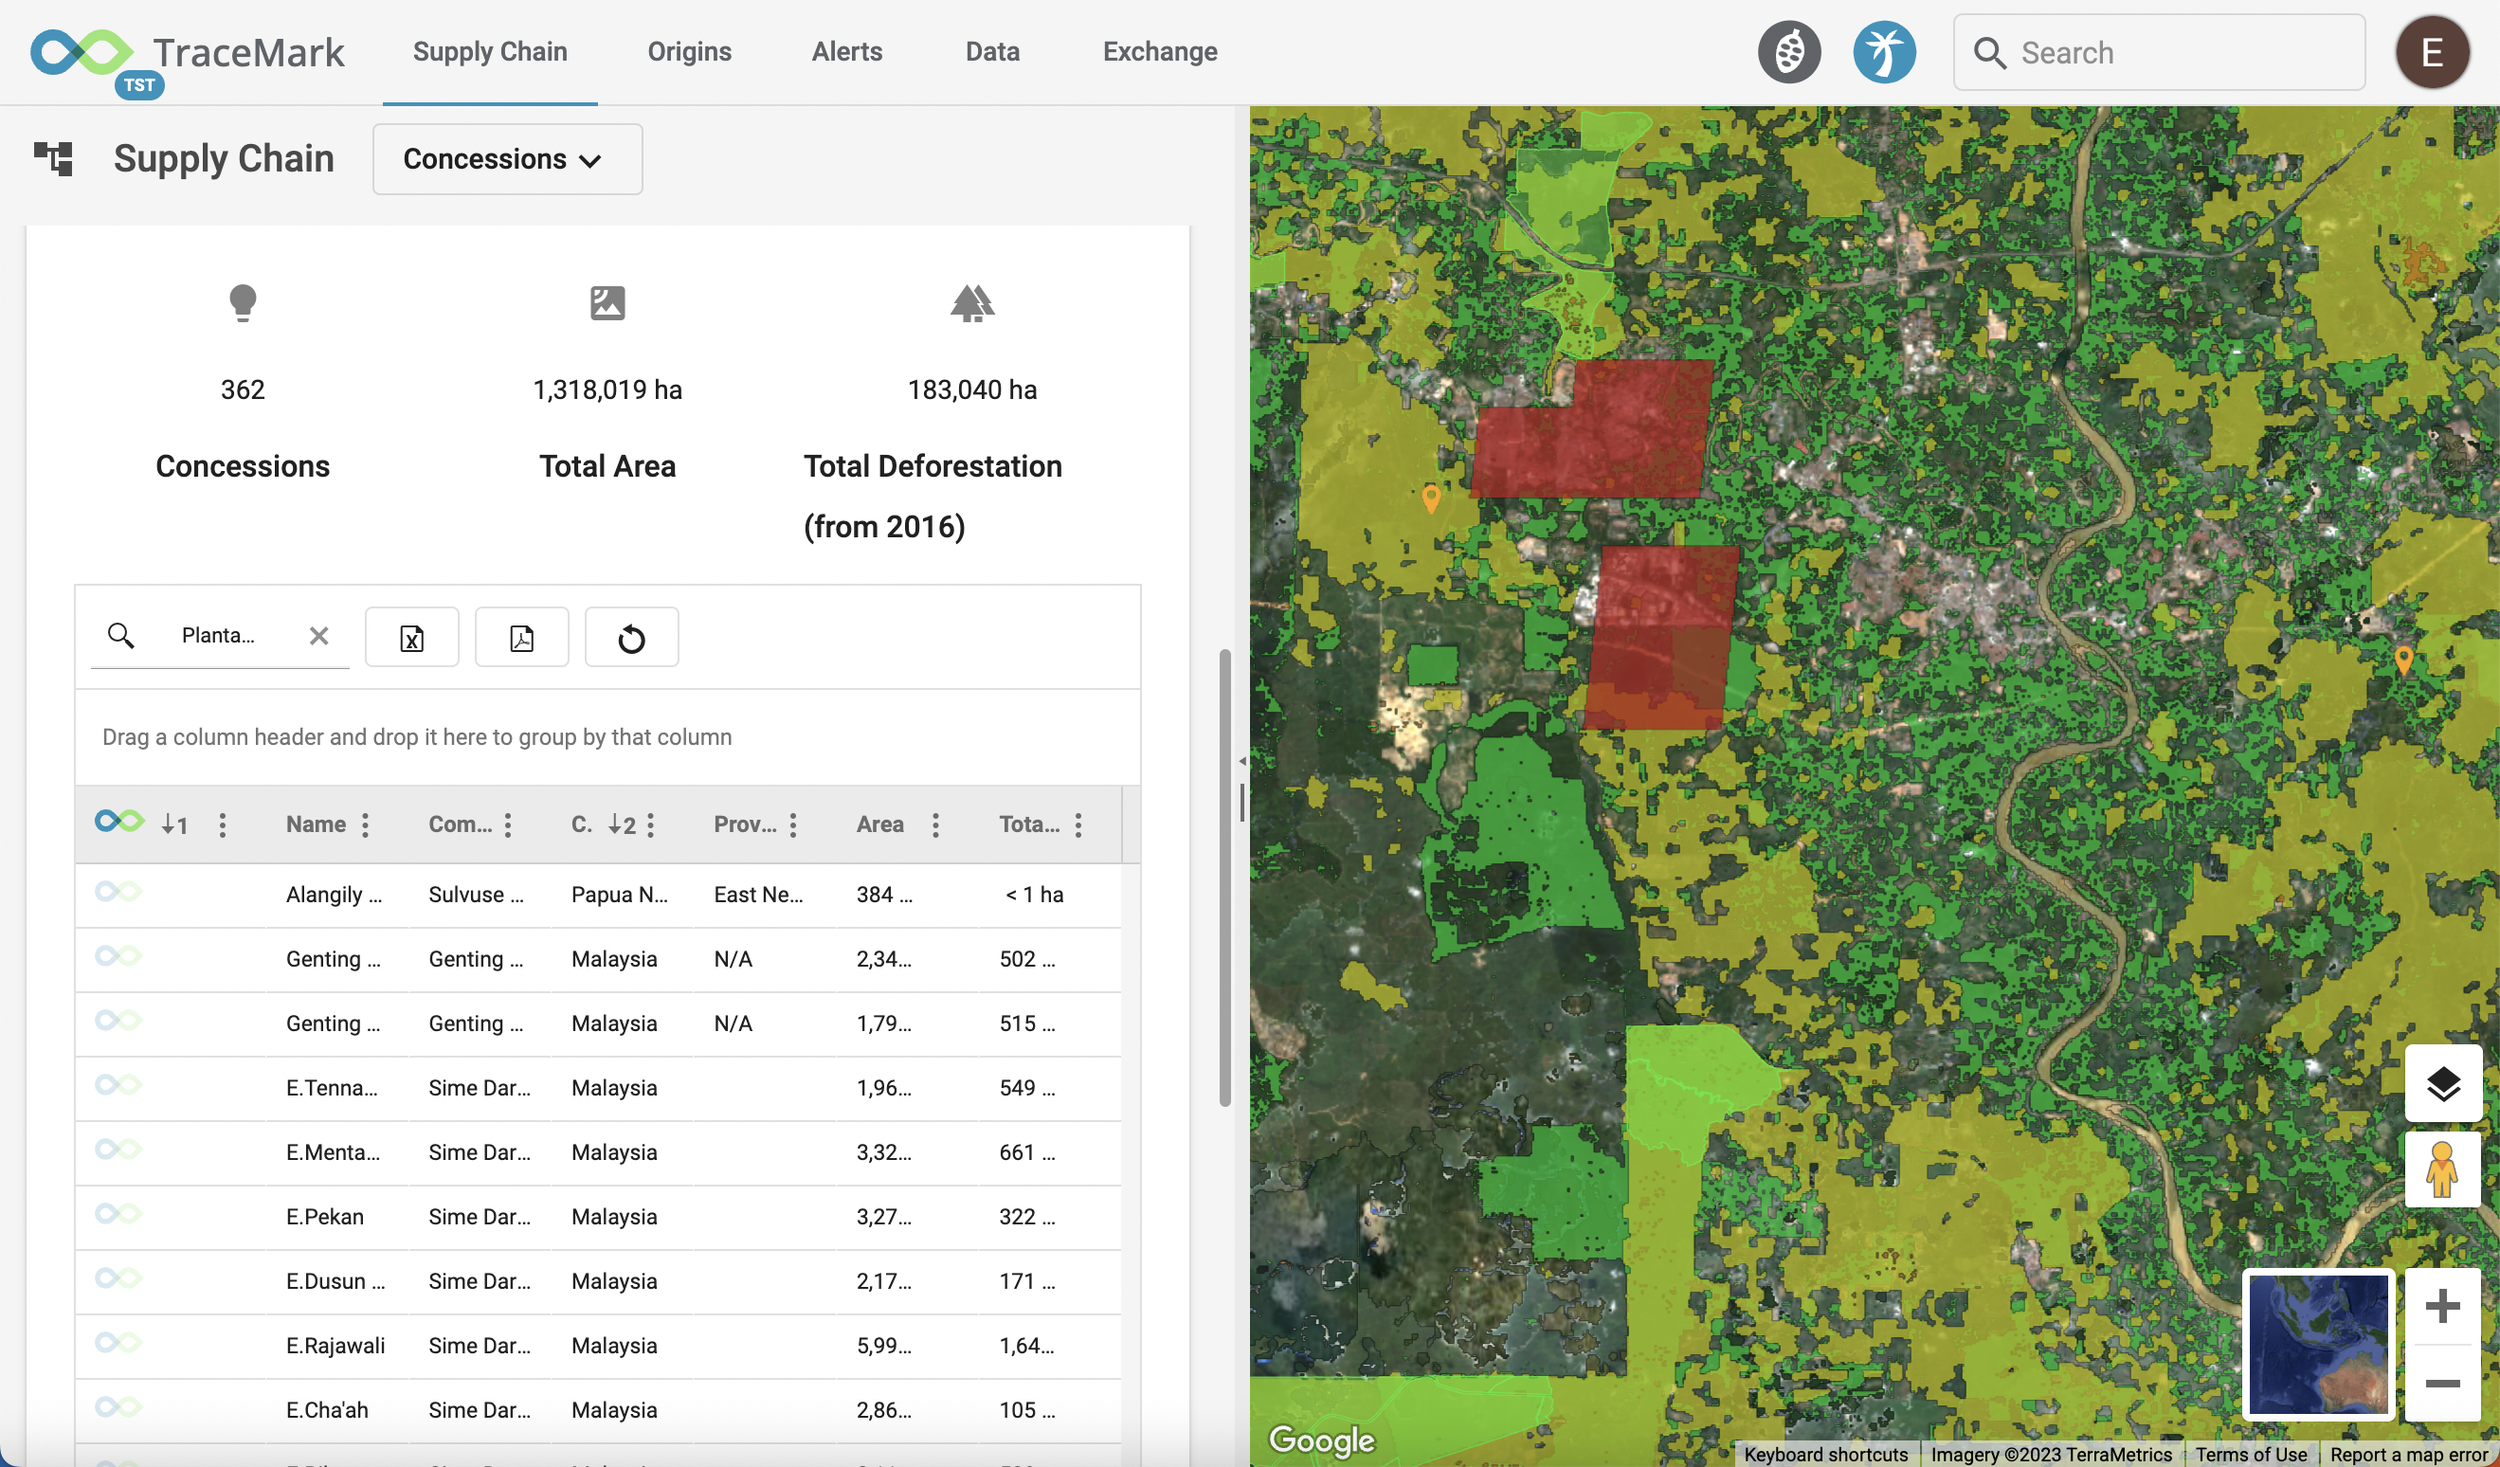
Customised ESG reporting dashboards
TraceMark™ helps to make sense of complex issues. With global supply chains and multiple suppliers based in different geographic regions, it’s important to understand the ‘bigger picture.’ With our customized dashboards you can gain the true impact of operations.
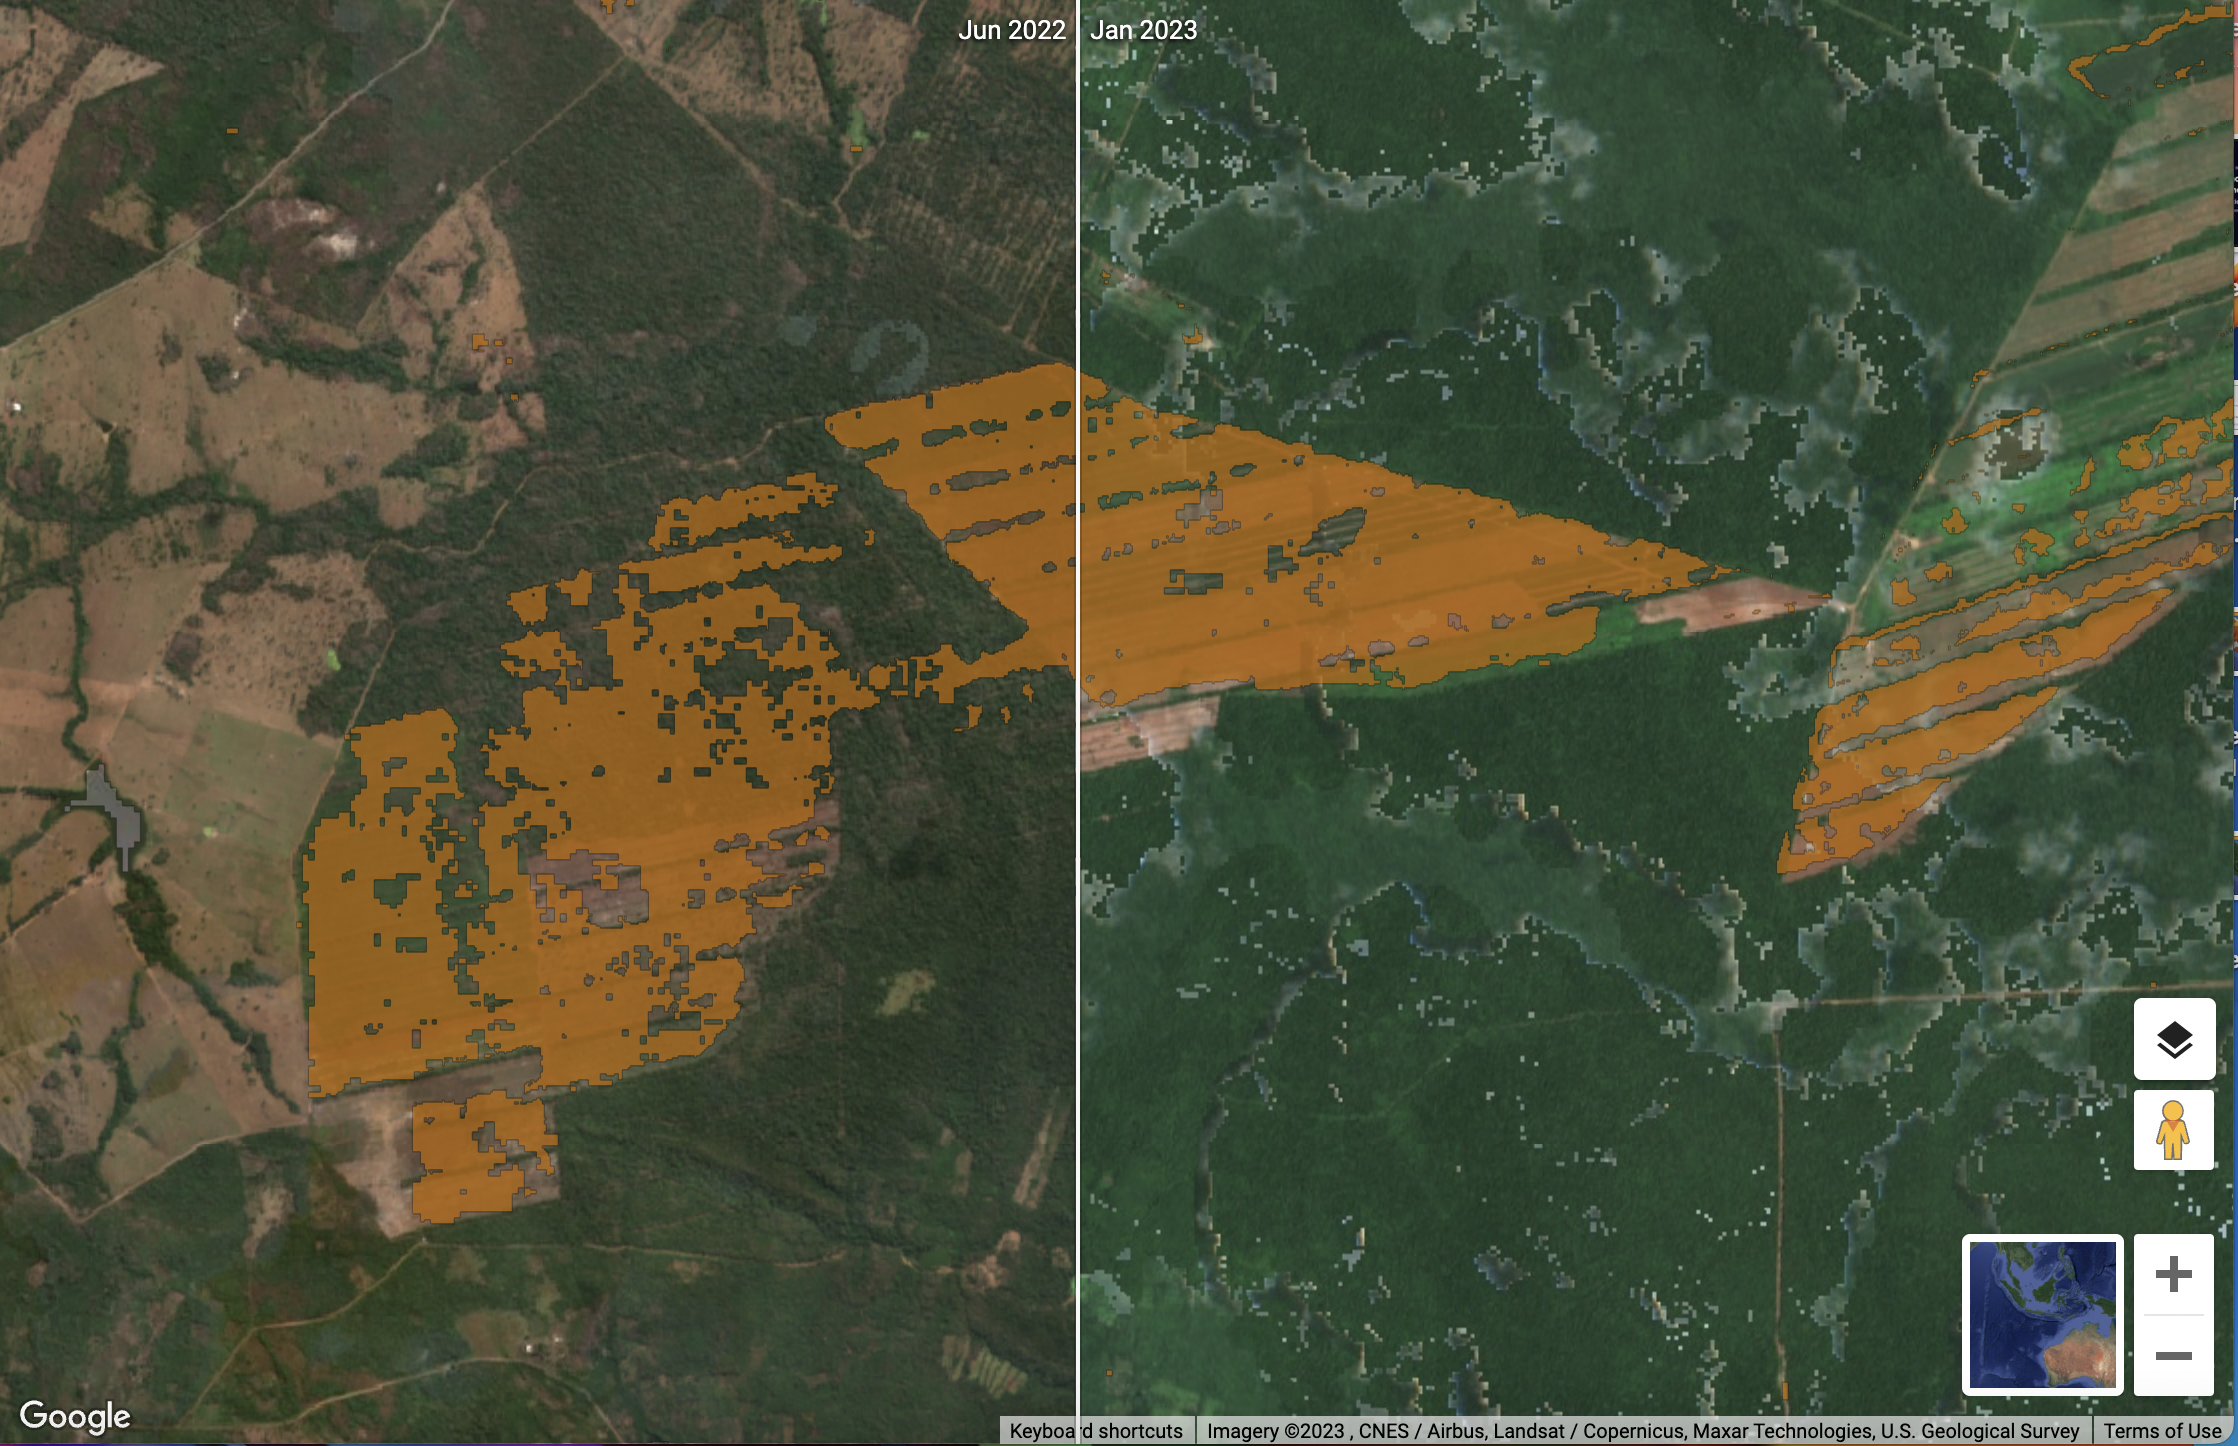
Visualise environmental impact
With TraceMark™, you can compare environmental degradation over time, including deforestation. This demo illustrates how the environment can dramatically change in just six months with the impact of deforestation.
Monitoring and reporting
The goal of TraceMark™ is to enable organisations to monitor progress towards meeting specific and significant corporate commitments to sustainability. TraceMark™ provides a self service, user friendly interface based on the familiar and high performing Google Maps API. Extensive and extensible reporting is available including:
Specific reporting period and reporting cadence
Supplier Level Benchmark and Score Cards
Reporting for different commodities
Deforestation including volumes sourced deforestation free
Analysis of impact on protected areas
Reporting on sourcing footprints
Reporting on commodity are detection
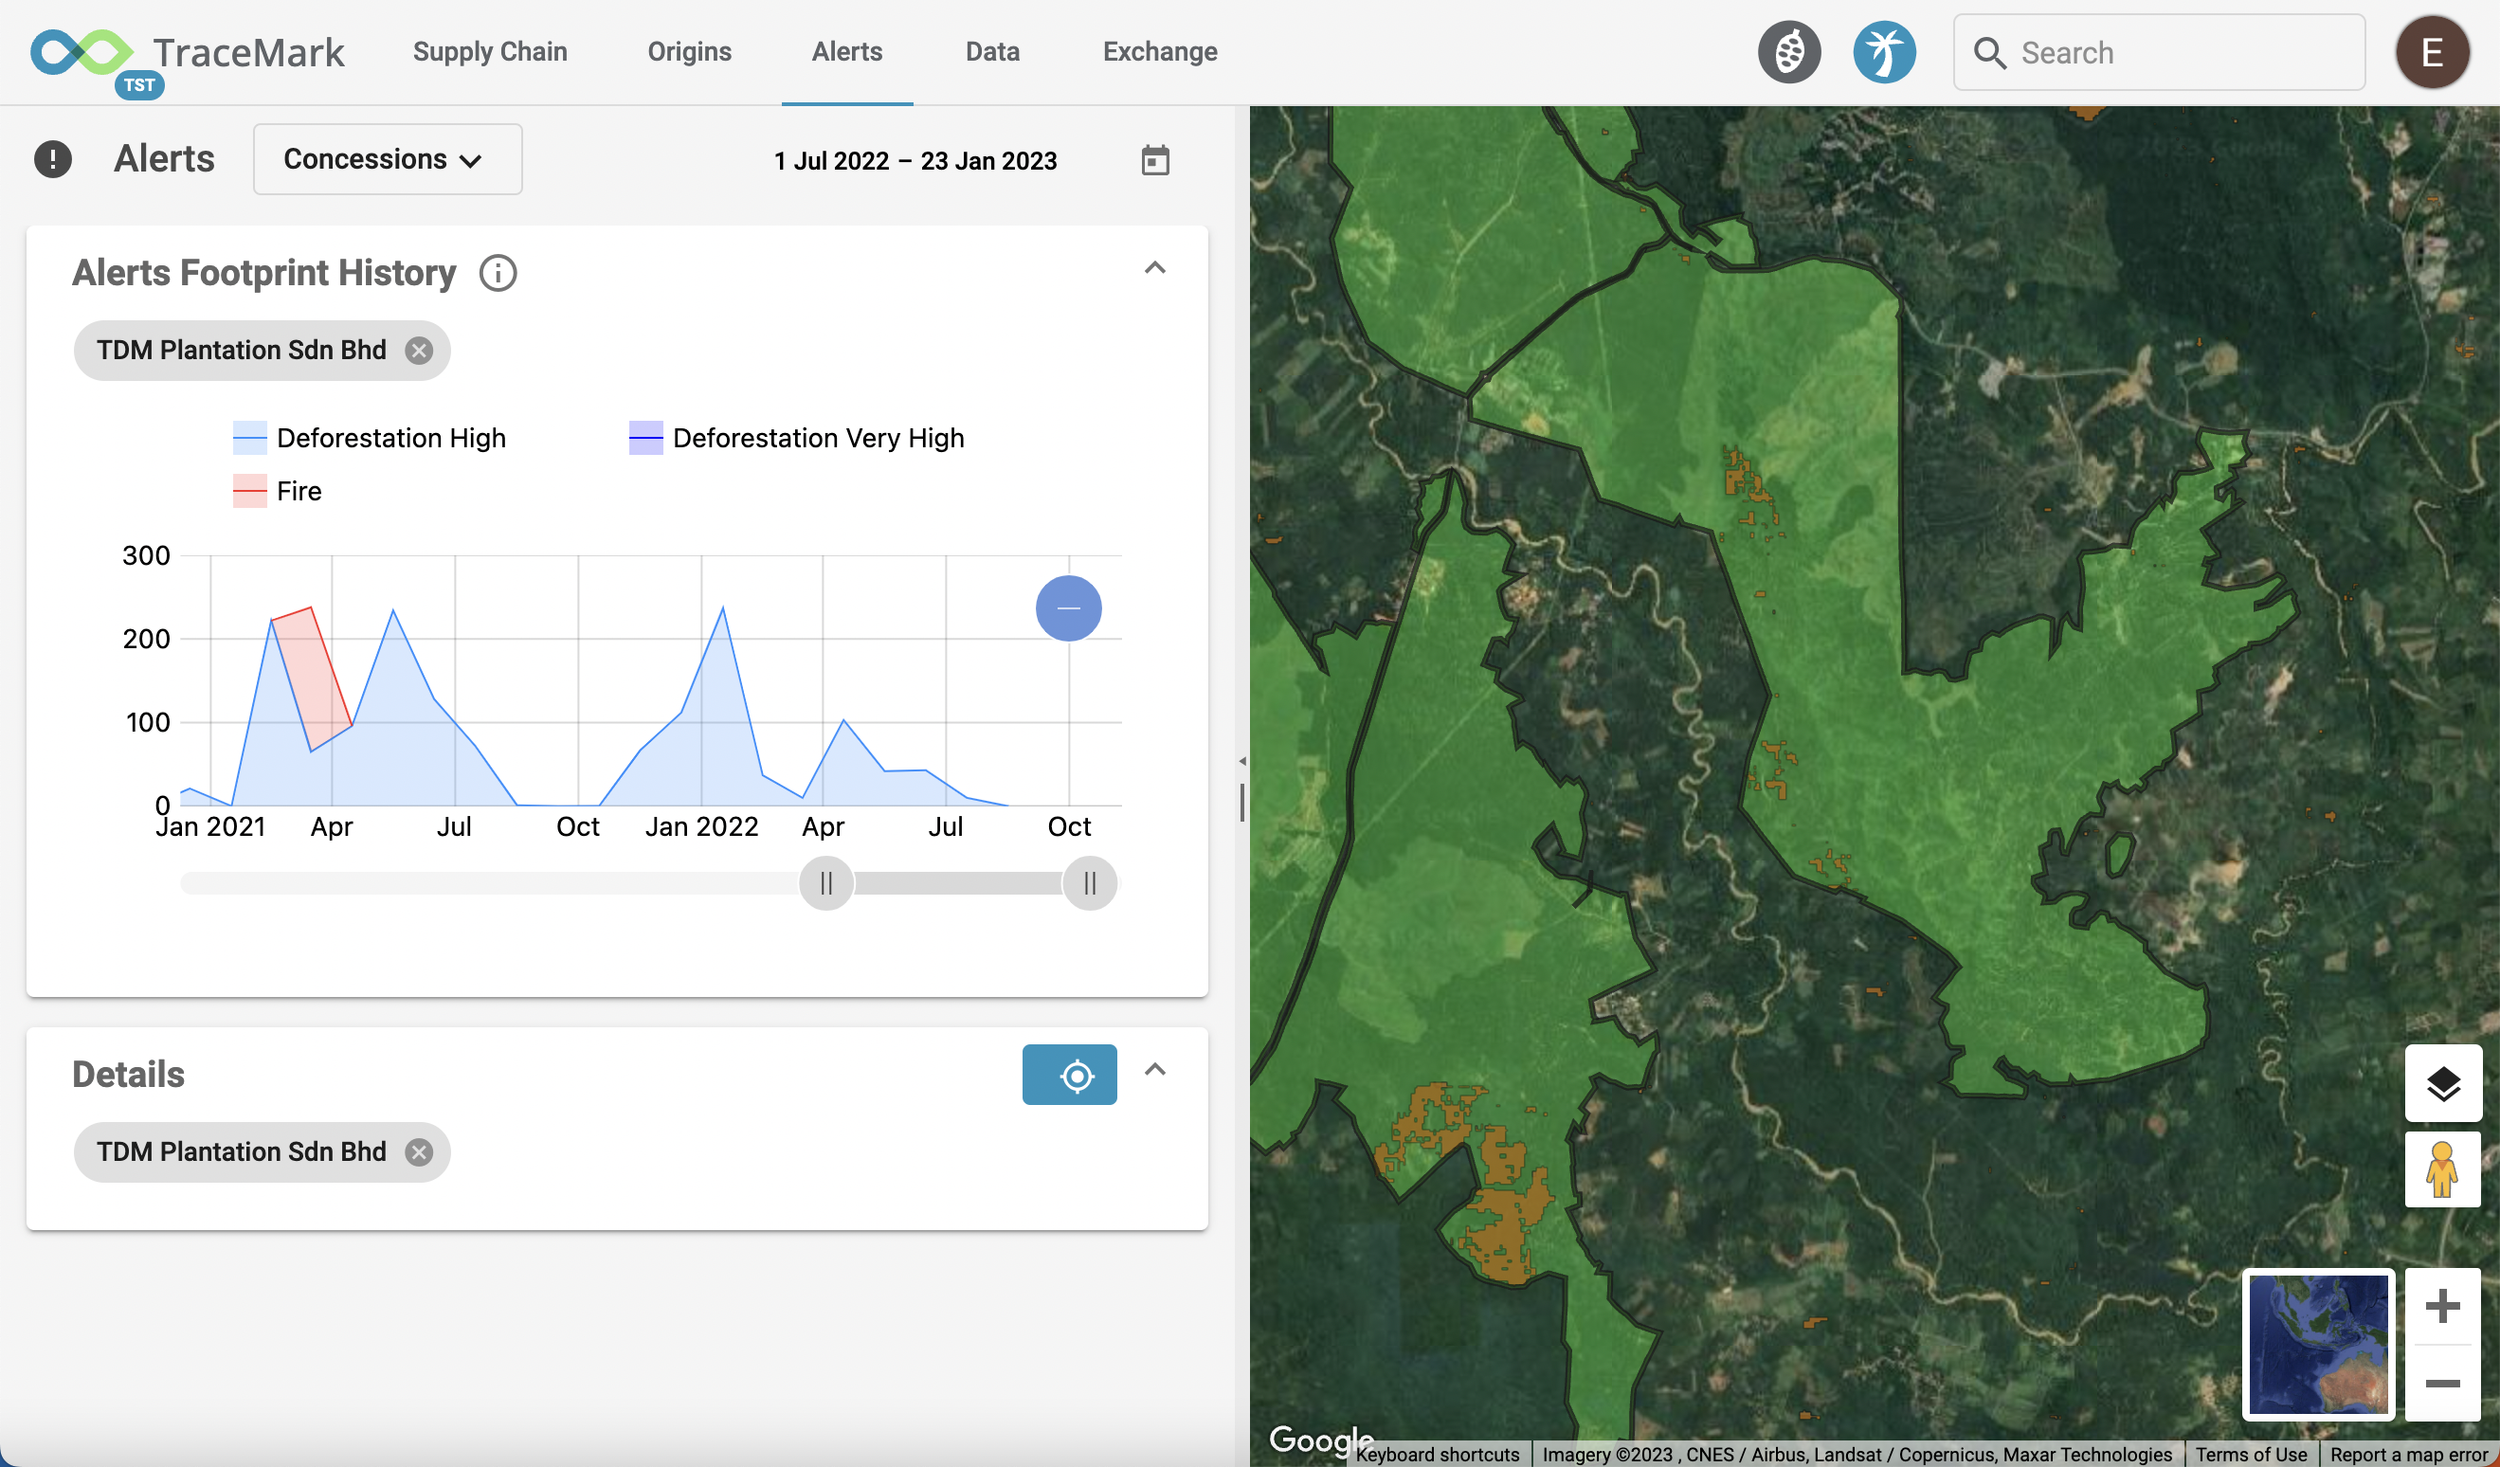
Reporting on Deforestation and Fire Alerts

Workflows and automation
To effectively monitor global supply chains TraceMark™ leverages high performing Google Cloud Geospatial technology to deliver automated land change analysis and alert notifications. TraceMark™ provides both Fire and Deforestation Alerts that intersect with sourcing origins and footprints, including aggregation of alert statistics through the supply chain. Alert statistics can be analyzed down to the first mile sourcing footprint including configuration of the date range for analysis. Alerts can be configured to be sent directly to the inbox of respective users.
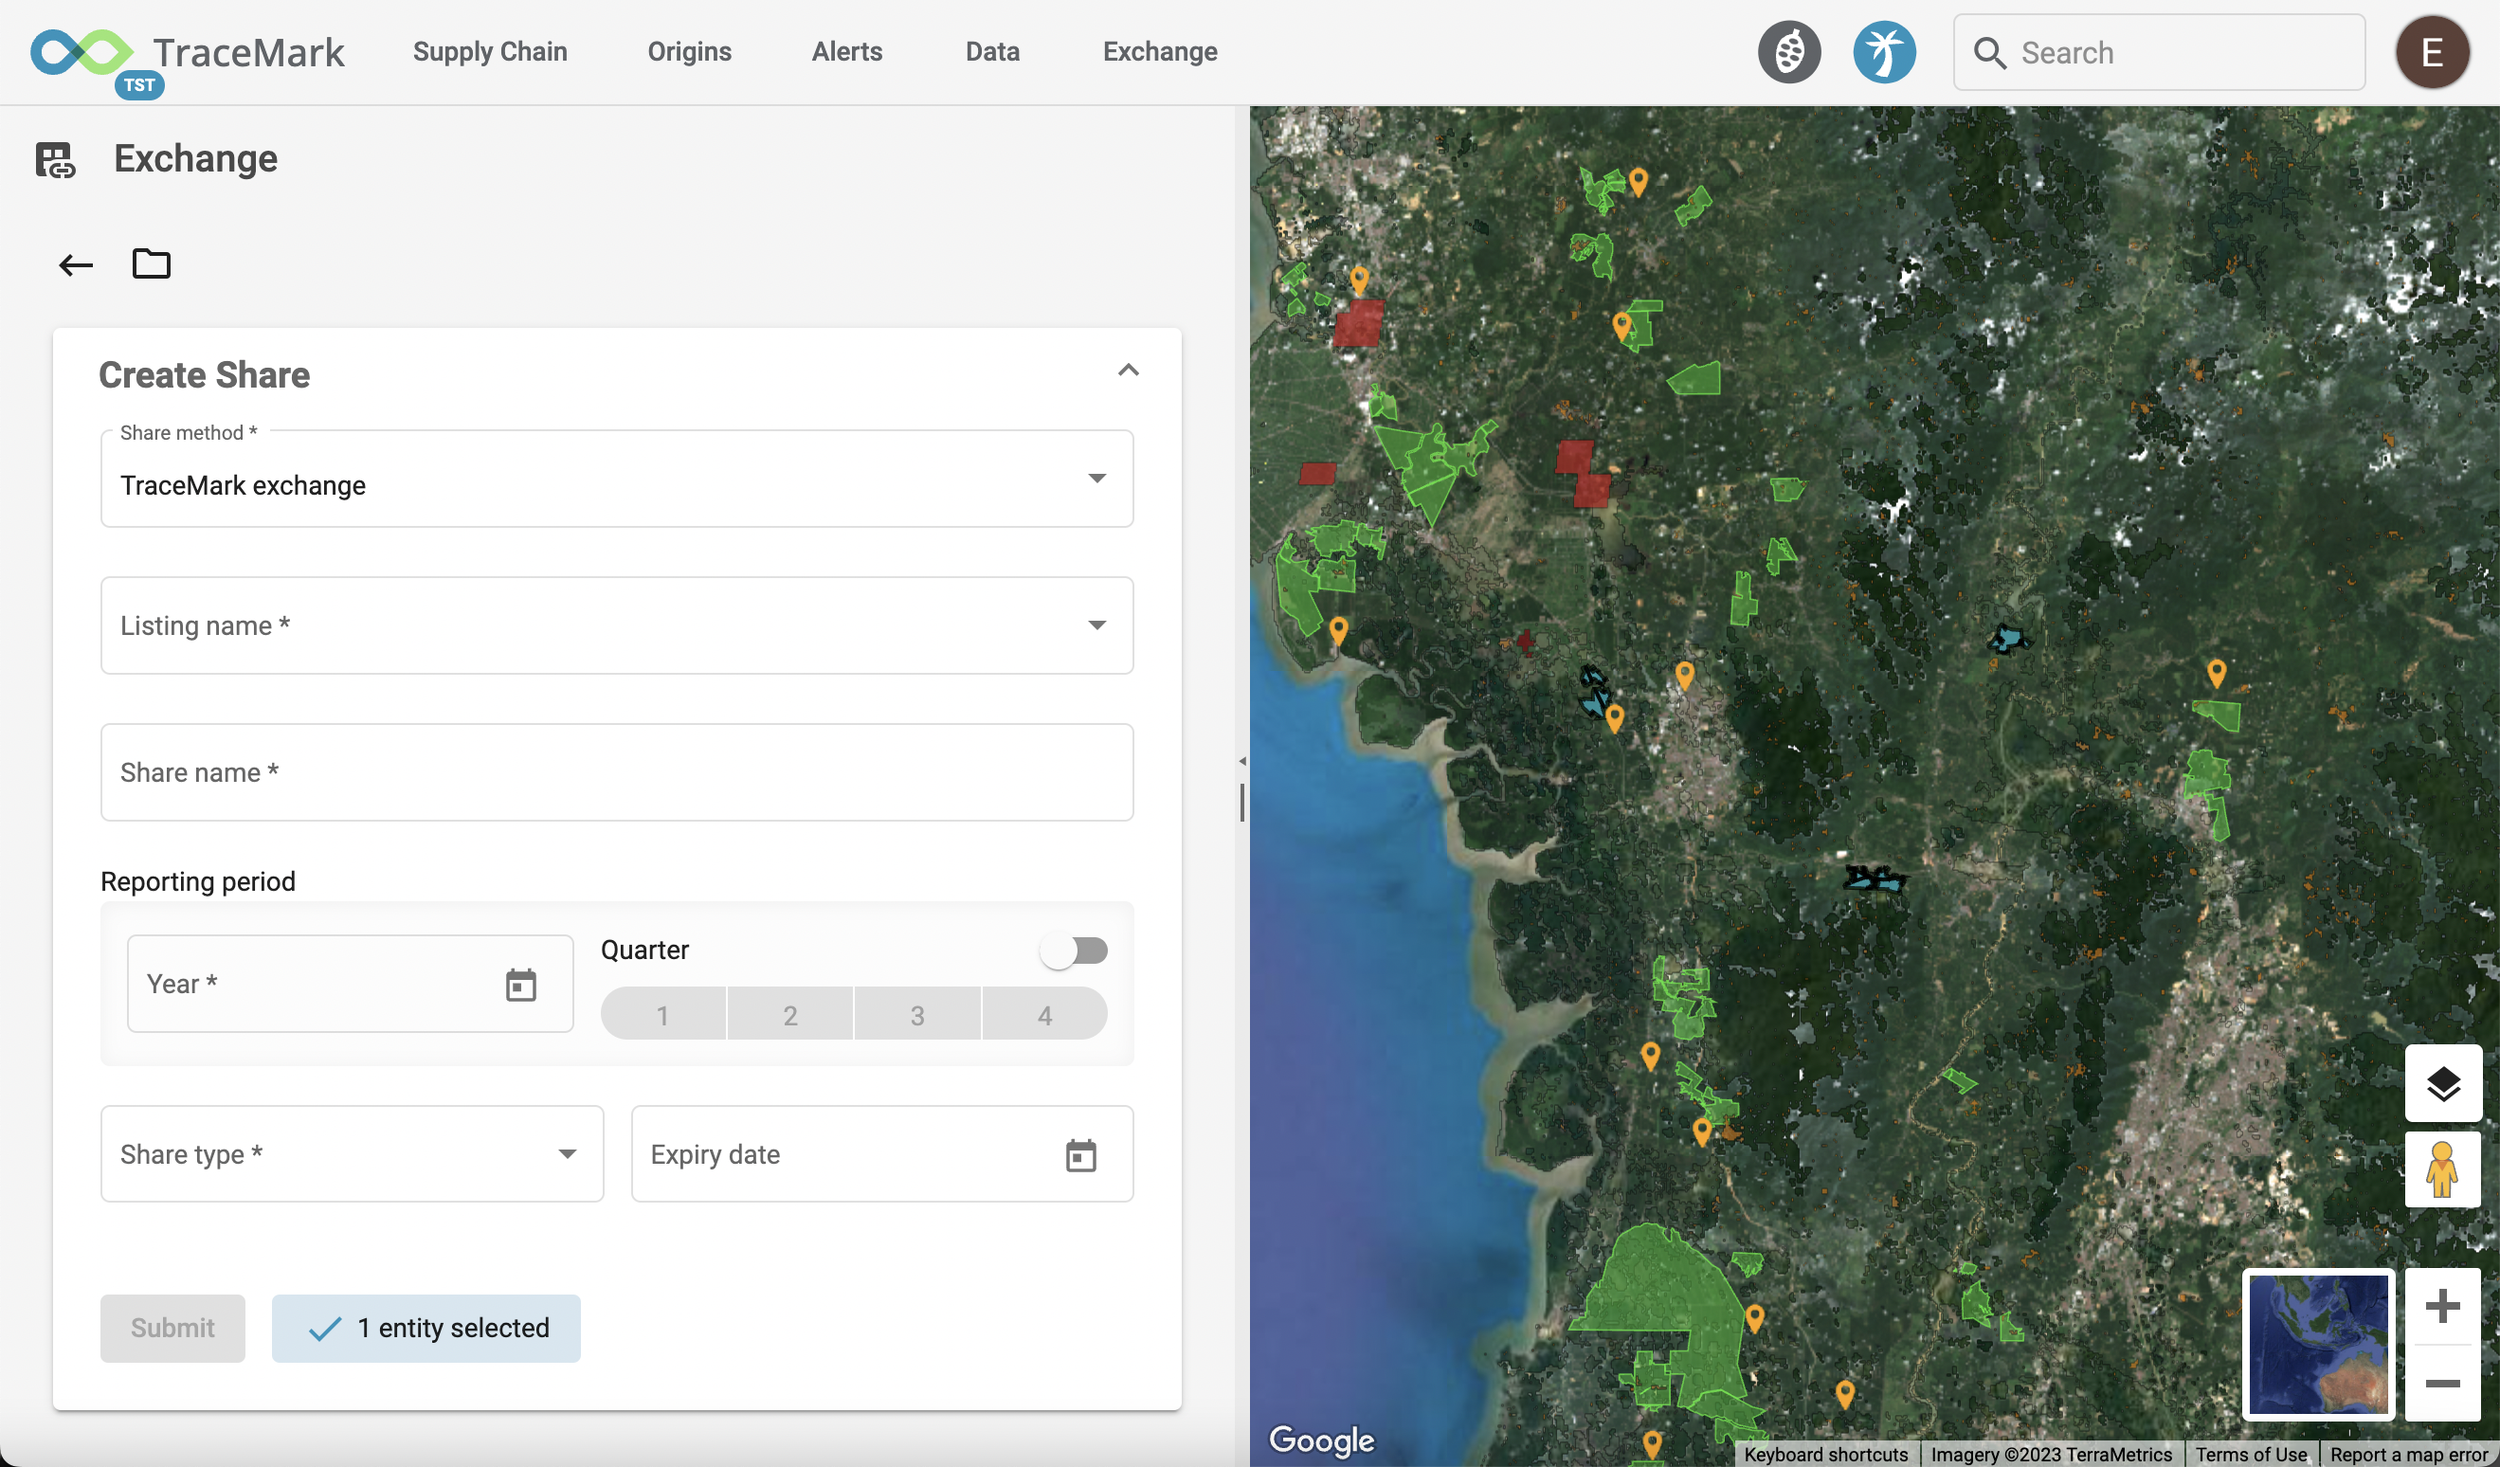
A sourcing data ecosystem
TraceMark™ provides a flexible commodity data model that addresses a wide variety of materials including Palm, Coffee, Cocoa, Soy, Cotton and Paper. TraceMark™ provides a data ecosystem built on Google Analytics hub, that will enable data to be controlled and shared between suppliers and customers. Analytics Hub provides the capability to securely exchange data assets internally and across organisations, without data movement and enhance analysis with commercial, public, and Google datasets
The data exchange capability of TraceMark™ not only provides an ecosystem for sharing sourcing data, but it also provides the opportunity to deliver common datasets and methods to both suppliers and customers, to facilitate two way collaboration based on common definitions and understanding
From certification to verification
The proposed introduction of Deforestation Free Product Legislation in Europe will not only ban the importing of raw materials that have been linked to deforestation, but the burden of proof will shift to companies to actually verify that the raw materials they source from suppliers are in fact deforestation free and not just from certified sources. TraceMark™ is enabling progressive companies to get ahead of the legislative curve by providing global first mile verification of deforestation through automated alerts and high resolution inspection capabilities.

Enterprise sustainable sourcing
This combination of SaaS deployed for each client, provides protection and security over data assets as well as enabling NGIS to provide extensive customization opportunities to tailor TraceMark™ to the specific sustainability commitments and requirements of organisations. TraceMark™ also provides integration patterns with enterprise business systems such as SAP to surface sustainability metrics within corporate purchasing systems and volume information.
